Quickstart
This section includes a step by step tutorial and a demo application to get started with QGeo to visualize maps, geodata and kpis.
Step by step
After the installation (described at Installation) the extension can be added to Qlik Sense worksheets. Therefore the worksheet needs to be set in edit mode and afterwards the QGeo extension can be dragged and dropped to the worksheet from the custom objects panel.
Step 1
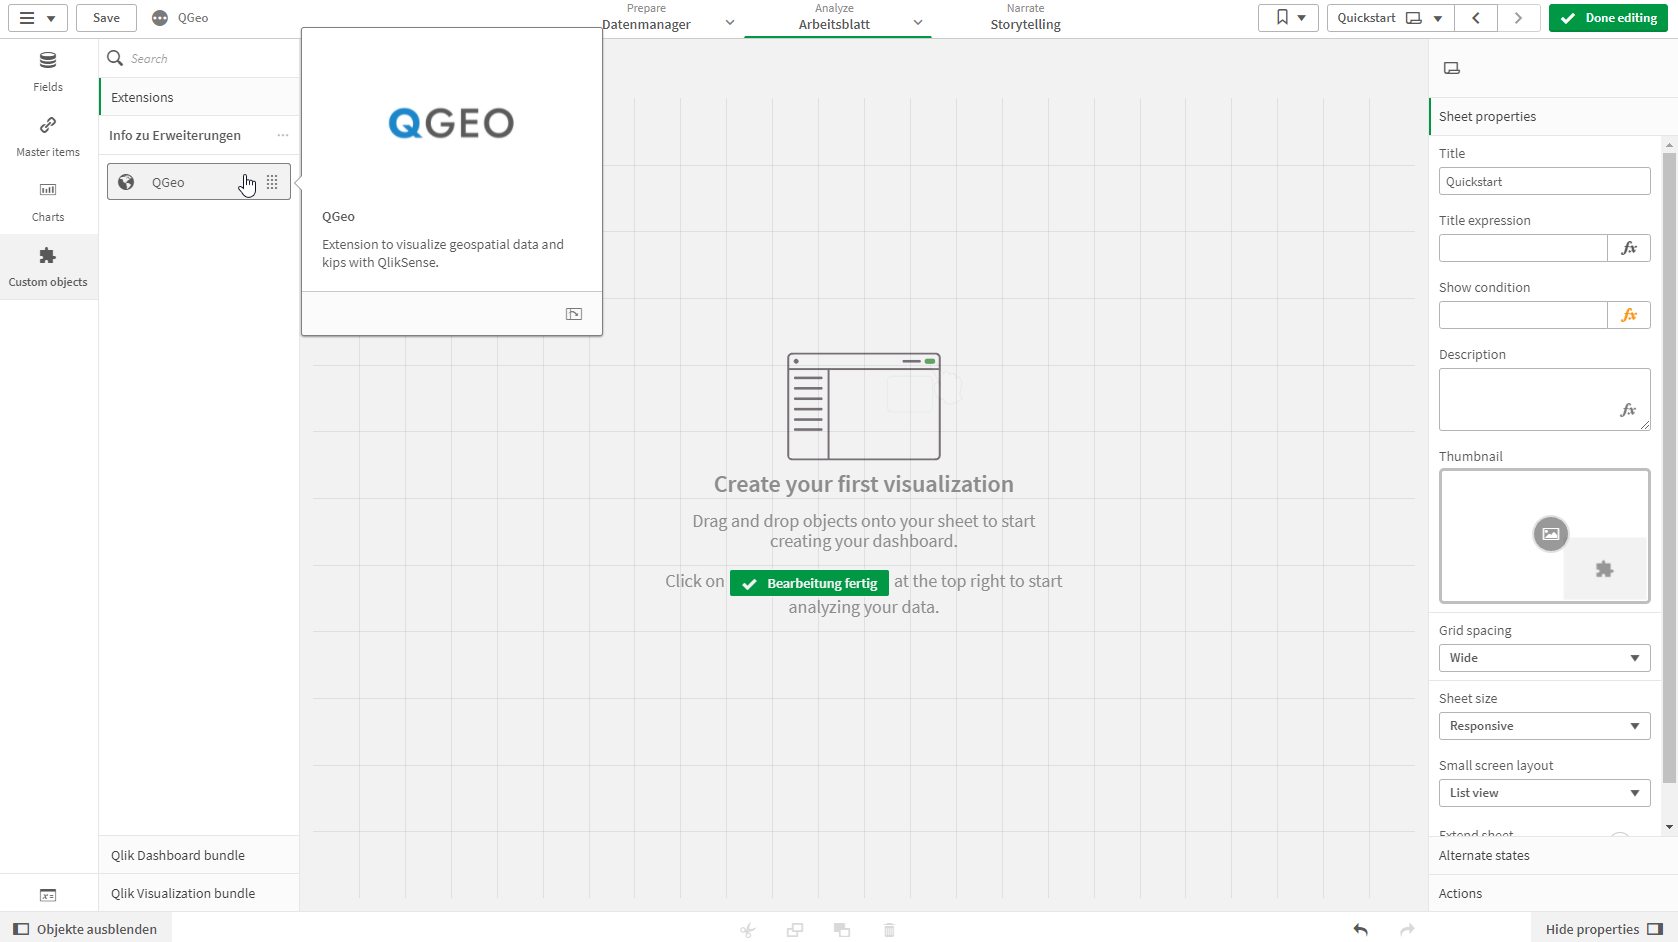
Set the worksheet into edit mode and select the QGeo extension from the left custom objects panel
Step 2
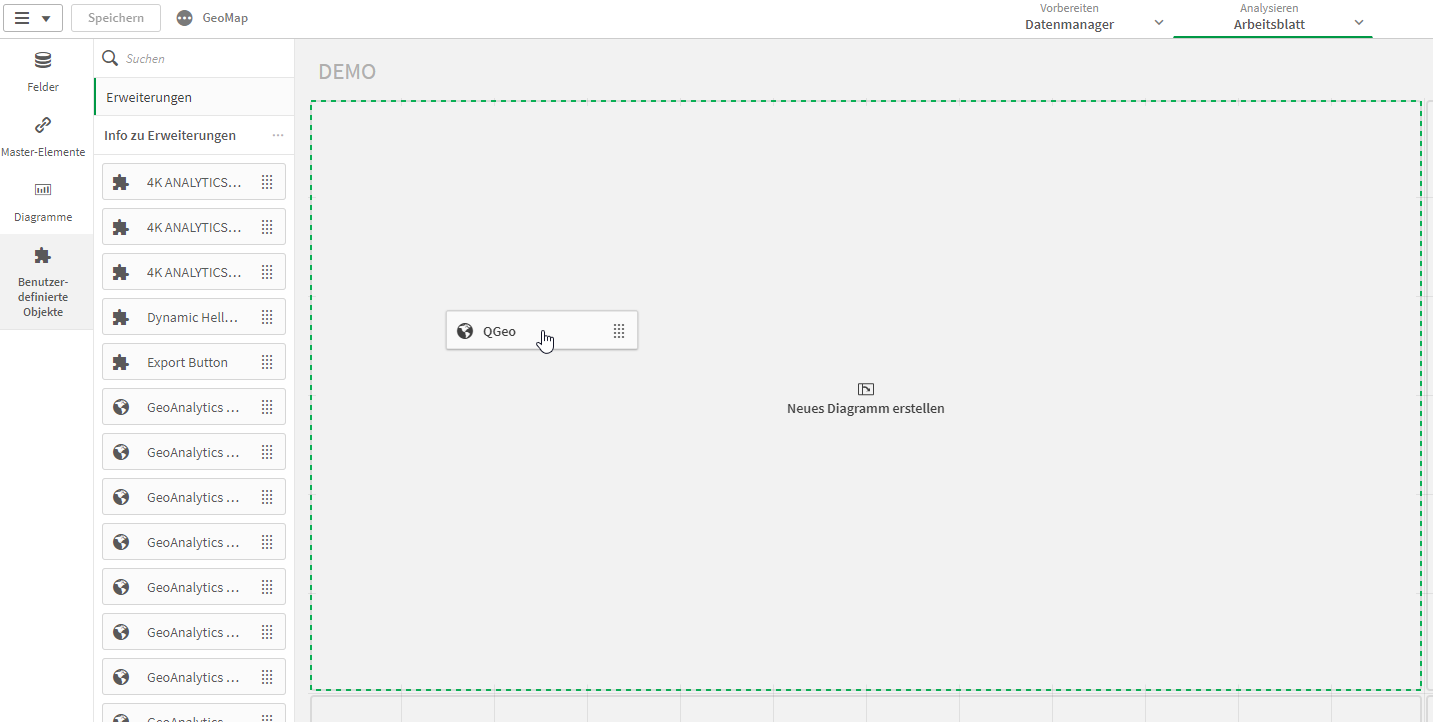
Drag and drop to add the QGeo extension to the worksheet
Step 3
Add/Select a dimension
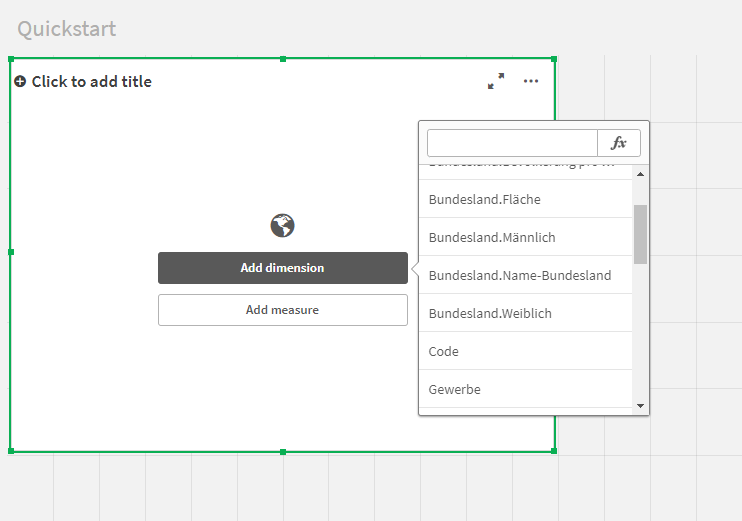
The added dimension functions as identifier and must match the selected identifier of the geodata (Step 5.2). It can only be added one dimension to the extension.
Step 4
Add/Select a measure
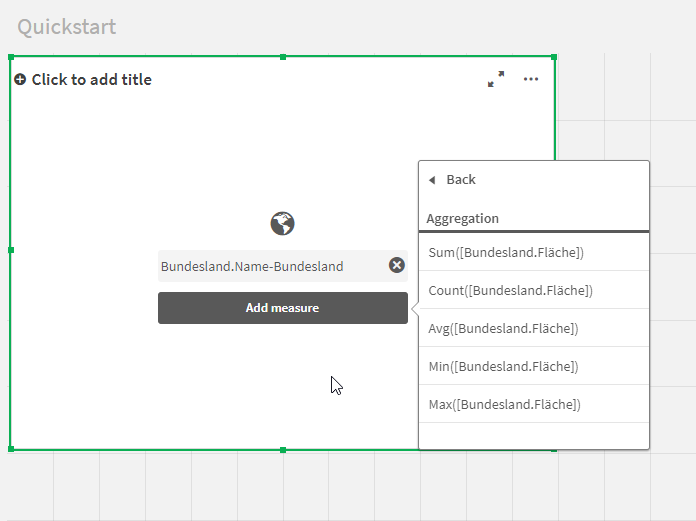
The first added measure represents the kpi/measure which is used for styling (coloring, labeling, etc.) the map. Multiple measures can be added to the extension. Only the first measure (index 0) is used for styling and coloring the corresponding geodata. Measures can be displayed in popups or labels.
Visualization of measurements
Please note that several measurements can be added to the extension which then can be shown in labels and popups on the map. The polygons of the geodata are colored depending on the first measurement.
At least one measurement must be added
Order of measurements can be changed within the extension via drag an drop
Step 5
Configure the extension from within the properties panel
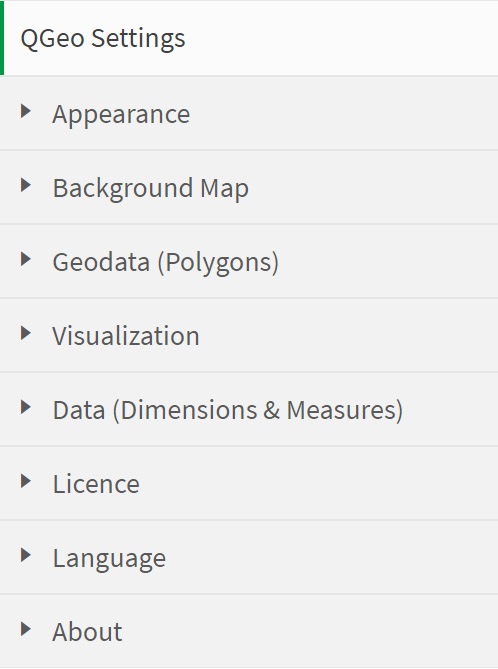
Step 5.1
Select a background map provider
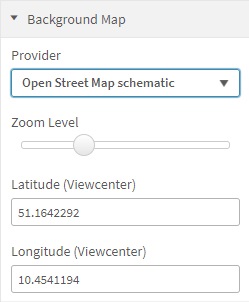
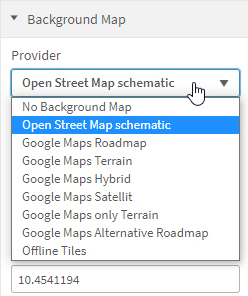
By default „Open Street Map schematic“ is selected as background map provider.
Step 5.2
Select map / geospatial data to visualize (polygons)
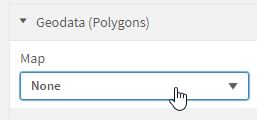
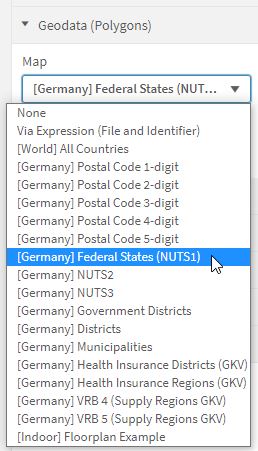
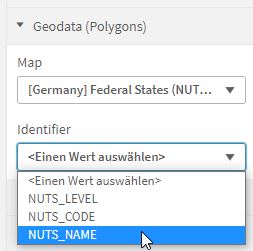
By default „None“ is selected as geodata. First select the geodata file to visualize on the map and after select an identifier. The values of the selected identifier must match with dimension values to successfully join features and visualize them on the map.
When values of the selected dimension (Step 3) match with selected identifier of the map file (Step 5.2) the corresponding polygon is visualized on the in dependence of the first measurement value.
Maps & Geospatial Data
More information about the geodata provided by the extension can be found in the Maps & Geospatial Data section. The selected map [Germany] Federal Stats (NUTS1) for example contains three possible identifier NUTS_LEVEL, NUTS_CODE and NUTS_NAME where the identifier „NUTS_NAME“ represents the name of the federal state (e.g. Sachsen).
Demo Application
QGeo provides a Qlik Sense demo application (as qgeo.qvf file inside the demo direcotry) which contains a number of worksheets with example visualizations. To include the demo application the .qvf file needs to be copied to the Qlik Sense apps directory:
C:\Users\[User]\Documents\Qlik\Sense\Apps
Within the demo application the following worksheets can be viewed and edited:
01-Germany-Federal-Districts
02-Germany-Cities
03-Federal-Districts-Companies
To learn more about how to use the extension take a look at the configured settings inside the properties panel.