Visualize Maps, Geodata and KPIs with Qlik Sense 12345 test
QGeo is an extension to visualize geodata and kpis on a map view within Qlik Sense.
An overview of how to get started with the extension can be found within the Quickstart selection.
Features
QGeo includes a variety of different features:
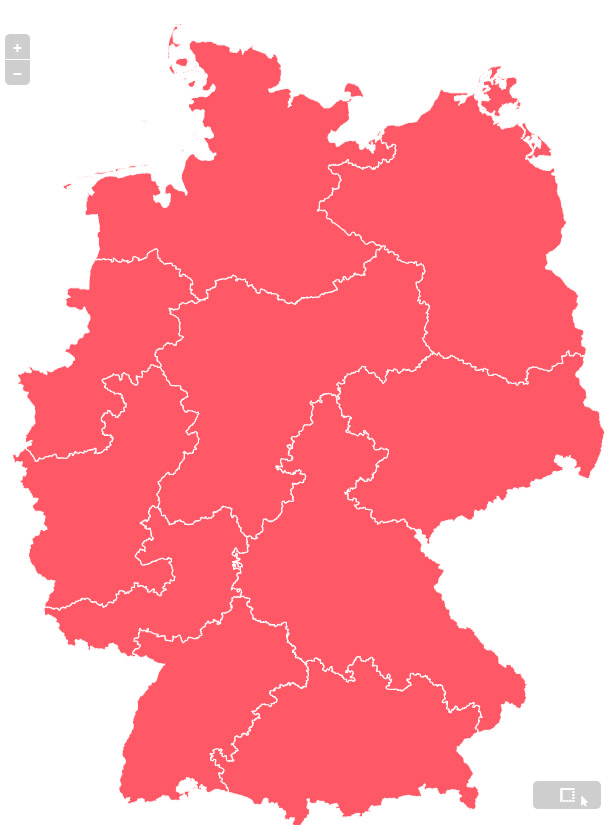
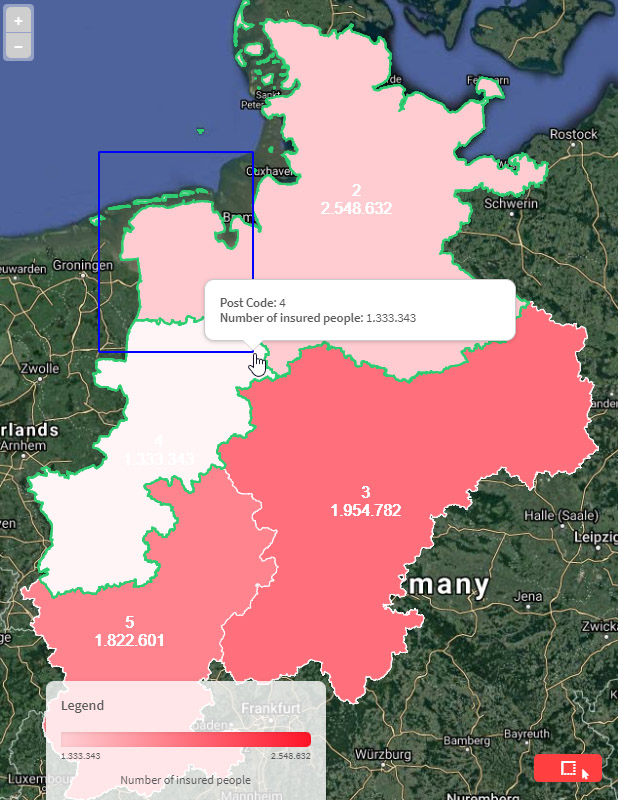
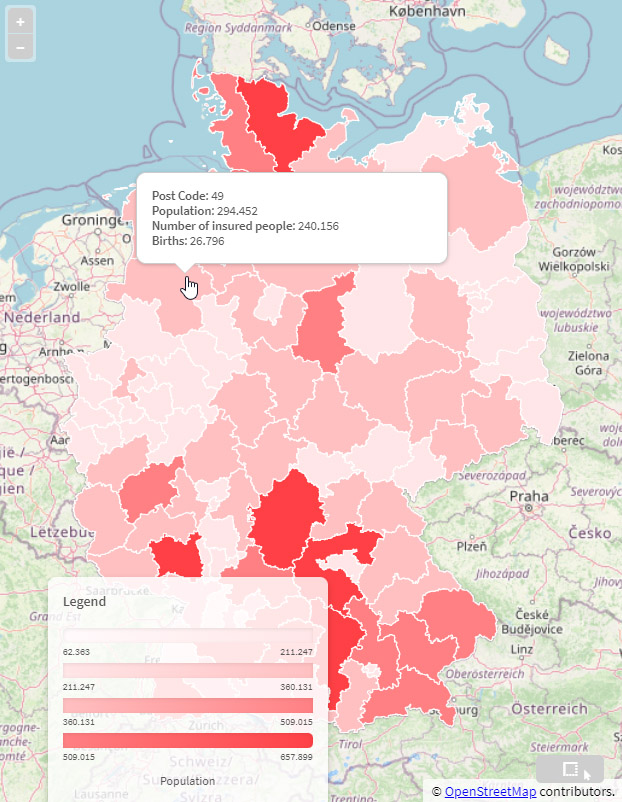
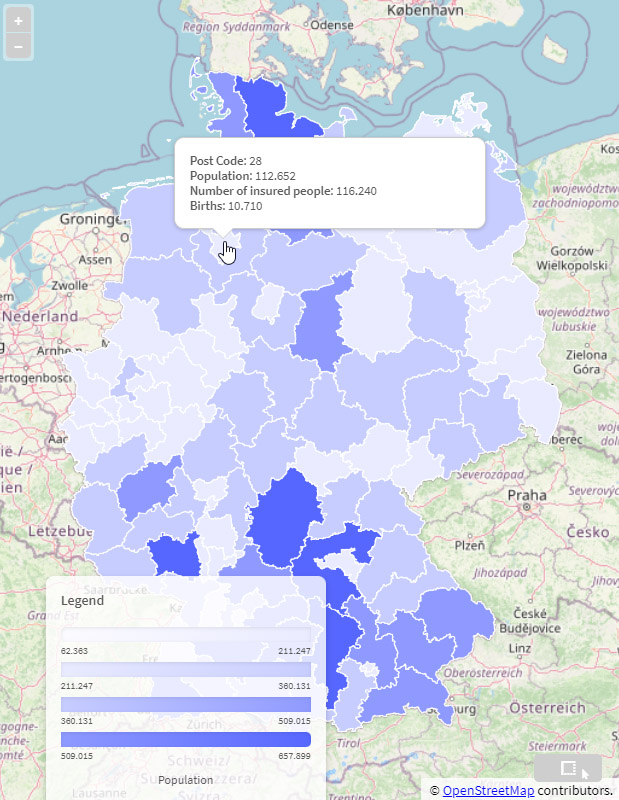
Visualization of geodata (polygons, lines, points) on a map
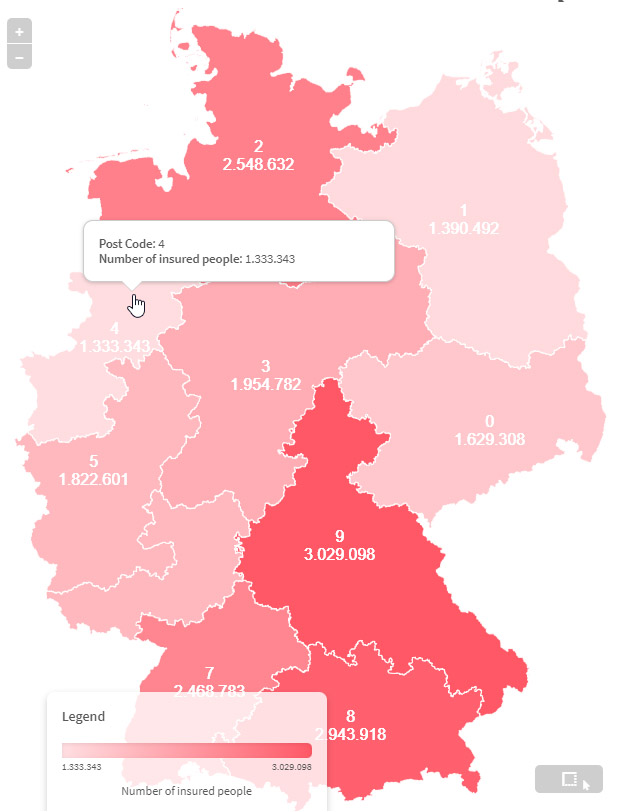
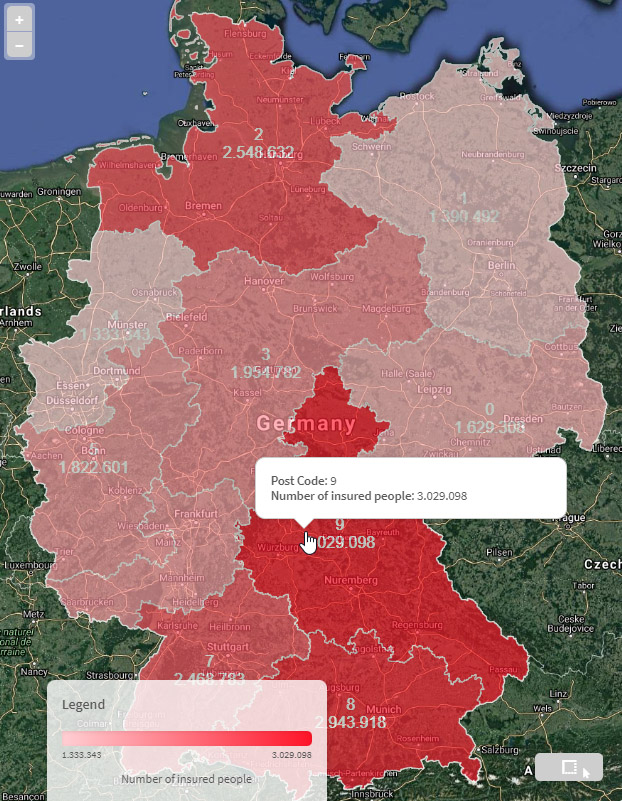
Coloring and styling of geodata and map features according to measurements
Selection of different background map providers (e.g. OpenStreetMap, Google Maps, etc.)
Configuration of the map view (view center, zoom level)
Label, legend and popup elements for displaying additional information and measurements
Load and visualize custom map data
Data
The extension includes ready to use maps and geospatial data (listed and described at Maps & Geospatial Data) specifically for germany. Further data and individual maps can be provided on request.
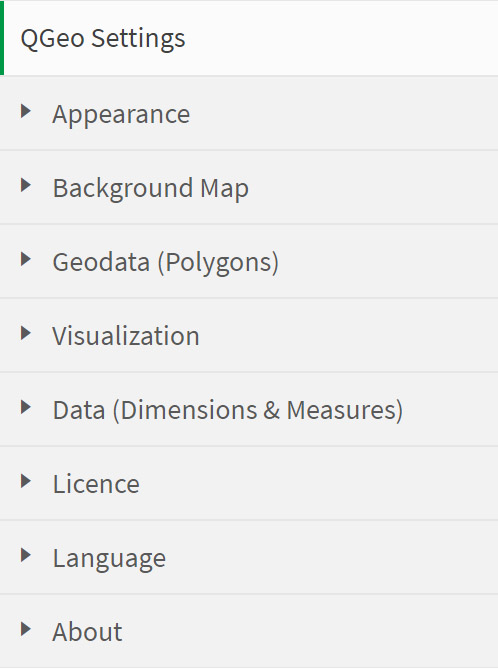
Settings
Users can create custom map visualization by configuring the extension from within the properties panel (as described inside the Settings section):